From here on, you have the choice to either copy and paste the sequence, or to directly upload the file. Then, click on the Send button.
Hello !
This page will help you understand how to input sequences and how to manipulate
the output. This tutorial is done so that you can follow the different steps by
yourself, so make sure to keep it open in another window or tab.
For any additional question, please read the
FAQ.
Let us first explain the page you just arrived on. Start by downloading
this file (if your browser displays it instead of downloading it, right-click on the
link and select the appropriate option). As you can see it is a simple file
containing a sequence in FASTA format. All files or sequences you want to process
have to be in this format, although it is not mandatory to have a header. The
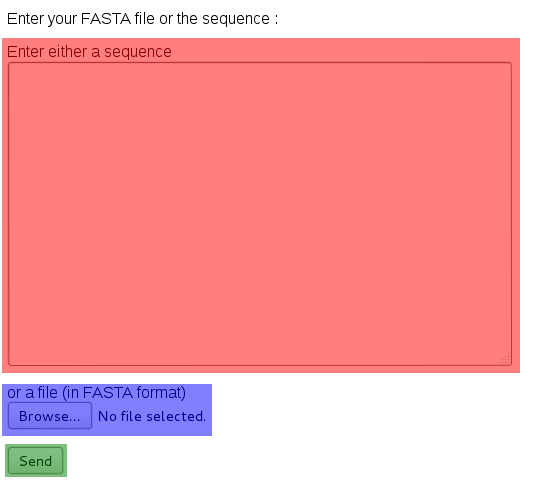
image below shows the page you just
came from ; as you see it is divided into three input fields : one in which you
can insert some text (in red), another where you can select a file (in blue), and
finally a button (in green).
From here on, you have the choice to either copy and paste the sequence, or to
directly upload the file.
Then, click on the Send button.
So you just ended on another page ! This page's role is to collect all runs you
have launched, and let you see their status, the input and the output.
Every time you submit sequences, a job ID is assigned to them,
which you can see under the Job section (yours is going to be
different, since it is assigned randomly).

You just launched the run, so you should see a Running... under the
Status field. For now, you can only check the input you
submited, so wait a few seconds and
refresh the page using your navigator's way to do it (usually pressing your F5
key works).
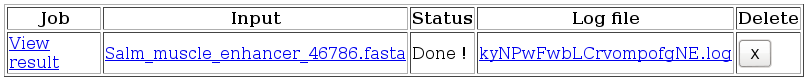
This is how it should look now, if our tool has finished processing the input. As
you can see, two new possibilities are offered to you : you can now get access to the
log of your entry. Unless something went wrong (which should not be the case), do
not lose time reading it unless you know the tools we used ; if something did go
wrong, the field Status should not display Done ! but Error.
The other - and the interesting one - new possibility is the ability to view the
output of your run, by clicking on View result.
Before clicking on this, you should know that several runs in parallel are possible ; you only would need to click on Submit a run on the top of the page. Also, you can come back anytime to the page directly without submitting another run by clicking on View runs anytime. Also, please be aware that all your runs are regularily deleted (see FAQ).
Clicking on View result leads you to the visualisation page. The first thing
you see are the visualisation options.
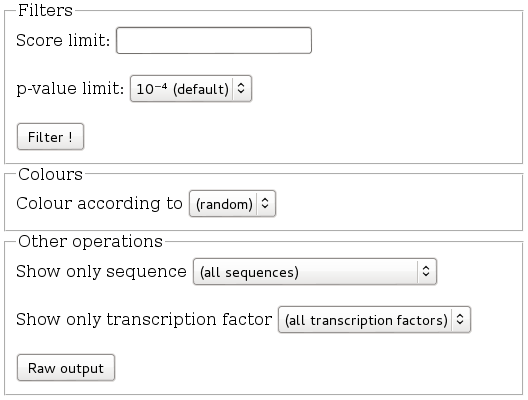
We will not lose too much time on this section for now ; please for now select
p-value in the Colours section. This will change the
visualisation below by colouring the output, and it should now look like the picture below.
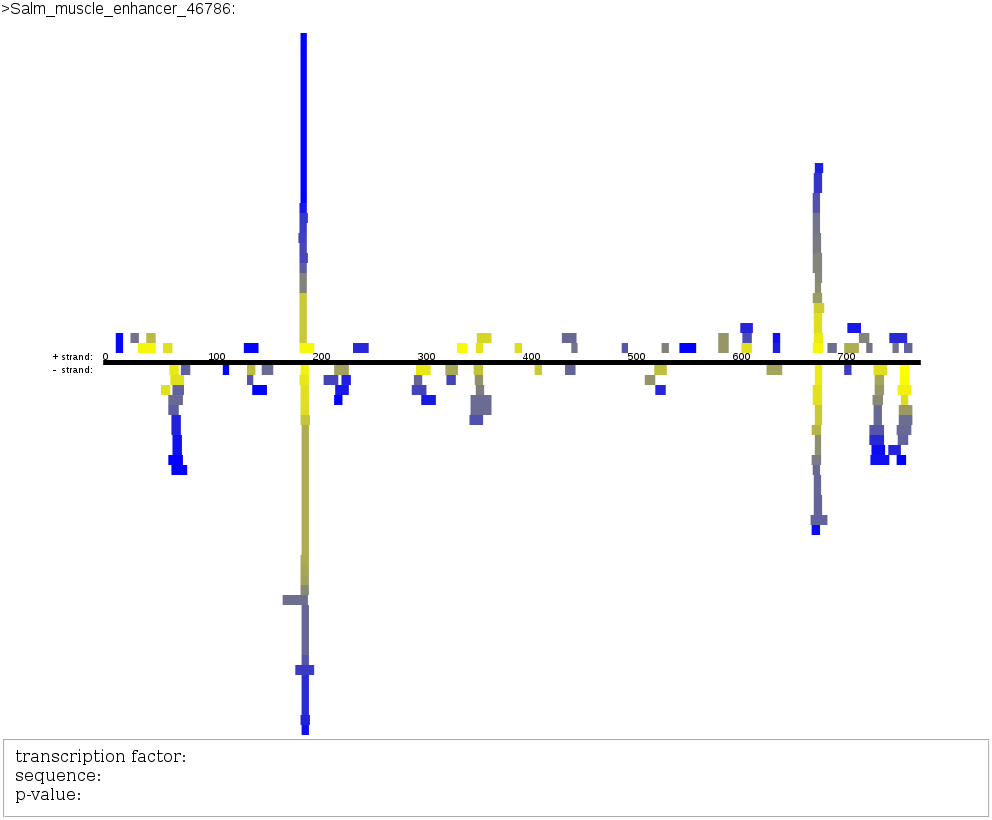
As you can see, you have the name of the sequence (Salm_muscle_enhancer_46786),
then a strand in black in the middle, the positive strand being the above part,
and the part below being the negative strand. By selecting a colouring according
to p-value, we see that the rectangles representing the transcription
factors get more and more yellow as they come closer to the strand, and more and
more blue as they go far away : we have just classified the transcription factors
along a blue to yellow color scale. Also, there are a lot of transcription
factors which seem to have a p-value below 10⁻⁴ in a position close to 200bp.
By hovering on the boxes with your mouse, you should be able to see the name,
the sequence it is bound and the p-value of the transcription factor under your
mouse. Try finding the transcription factor inv and find its best
p-value. (Reminder : the lower a p-value is, the better !)
You may not want to take too many transcription factors into account, and select only the best. Into the Filters section, set p-value to 10⁻⁶, and click on the Filter ! button. Not many transcription factors remain. Setting it the p-value limit to 10⁻⁵ is for this sequence not enough to eliminate any transcription factor, and 10⁻⁶ eliminates all of them. In order to get a less crowded view, reset p-value to default, and put 12 for the score, and click on Filter ! again. As you see, the view gets less crowded.
If you change the colouring in order for it to be according to score, you should get a surprise : the transcription factors with the best p-value are not those with the best score ! Please take this into account when using our tool : score and p-value are not totally correlated, as soon as you approach good p-values.
Since you have only one sequence, you cannot experiment well with showing only
one sequence, but please be aware that if you have several sequences, you can
either display all of them or only one. The same applies to transcription factors.
Please select p-value as a colouring method. Then, in the other
operations section, select inv as the transcription factor to show.
As you see, all occurrences of this transcription factor take place on the same
position, but with two different binding sequences : the two occurrences with the
lower p-value bind to an additional G.
Please select (random) as a colouring method before setting the shown
transcription factors back to (all transcription factors).
A description of the Raw output is not part of this tutorial, so since you are finished, click on View runs. You there have to possibility to clean up your data by clicking on the x button under the Delete section. This guided tour is now finished !